Market Outlook
September 26, 2017
Market Cues
Domestic Indices
Chg (%)
(Pts)
(Close)
Indian markets are likely to open in flat tracking global indices and SGX Nifty.
BSE Sensex
(0.9)0.3
(296)6
31,627
U.S. stock market indexes ended lower on Monday on the back of a fresh flare up in
Nifty
(0.9)0.4
(92)33
9,8736
tensions between the U.S. and North Korea and a sharp decline in technology
Mid Cap
(1.1)0.7
(177)5
15,433
shares. The NASDAQ plunged by 0.9 percent to 6,471, the Dow dipped by 0.2
percent to 22,296 and the S&P 500 slipped 0.2 percent to 2,496.
Small Cap
(2.0)1.1
(330)1
15,963
Bankex
(0.8)
(215)
27,184
The U.K. stocks slipped Monday, struggling as sterling climbed against the euro in
the wake of Germany’s general election, and as bank stocks sagged as the Bank of
England reiterated a warning about risks from credit growth. The FTSE 100 index fell
Global Indices
Chg (%)
(Pts)
(Close)
0.1% to close at 7,301, led by financial and mining shares.
Dow Jones
(0.2)
(54)
22,296
Nasdaq
(0.9)
(56)
6,371
Indian shares ended sharply lower for a second consecutive session Monday on
FTSE
(0.1)
(9)
4
7,301
concerns over fiscal deficit after reports emerged that the government is thinking of
spending `50,000 crore to boost the country's slowing economy. Muted global cues
Nikkei
(0.2)
(48)
20,350
also weighed on markets as geopolitical tensions persisted and elections in
Hang Seng
0.2
259
27,559
Germany and New Zealand set the stage for periods of political uncertainty. The
Shanghai Com
(0.1)
(3)
1
3,339
BSE Sensex dropped by 0.93% to finish at 31,626 after falling as much as 450
points in the afternoon.
Advances / Declines
BSE
NSE
News Analysis
Advances
1,556
1,314
PM launches ₹16,320-crore ‘power for all’ project
Declines
2,049
1,423
Detailed analysis is on Pg2
Unchanged
142
44
Investor’s Ready Reckoner
Volumes (` Cr)
Key Domestic & Global Indicators
BSE#
4,690
Stock Watch: Latest investment recommendations on 150+ stocks
NSE
29,598
Refer Pg7 onwards
Top Picks
#Net Inflows (` Cr)
Net
Mtd
Ytd
CMP
Target
Upside
Company
Sector
Rating
FII
(56981
(2(4,955)
442,334
(`)
(`)
(%)
Blue Star
Capital Goods Accumulate
763
850
11.4
MFs
8351
4,7,976
176,863
Dewan Housing FinanceFinancials
Buy
525
610
16.3
Asian Granito
Others
Buy
478
570
19.3
Top Gainers
Price (`)
Chg (%)
Navkar Corporation
Others
Buy
185
265
43.2
Sciiacem
198
11.6
KEI Industries
Capital Goods
Buy
318
371
16.9
More Top Picks on Pg5
Ubl
859
6.3
Aegislog
231
3.9
Key Upcoming Events
Bfutilitie
408
3.8
Previous
Consensus
Date
Region
Event Description
Reading
Expectations
Oberoirlty
423
3.8
Sep 26, 2017 US
Consumer Confidence
122.90
120.00
Sep 26, 2017 US
New home sales
571.00
587.50
Top Losers
Price (`)
Chg (%)
Sep 28, 2017 Euro Zone Euro-Zone Consumer Confidence
(1.20)
(1.20)
Sep 28, 2017 US
Initial Jobless claims
259.00
270.00
Infibeam
120
(16.8)
Sep 28, 2017 US
GDP Qoq (Annualised)
3.00
3.10
Ibrealest
201
(8.4)
More Events on Pg7
Dhfl
525
(7.6)
Jpassociat
17
(6.0)
Indigo
1,046
(5.9)
#as on 25th Sep, 2017
Market Outlook
September 26, 2017
News Analysis
PM launches ₹16,320-crore ‘power for all’ project
The Narendra Modi government, which started its ‘power for all’ campaign in
rural India with the Deen Dayal Upadhyaya Gram Jyoti Yojana (DDUGJY), is
continuing its campaign, with the Prime Minister on Monday launching the
Pradhan Mantri Sahaj Bijli Har Ghar Yojana — Saubhagya.
Launching Saubhagya scheme, Modi said: “There are over 4 crore households in
the country without electricity. That means almost 20 per cent of all 25 crore
households are devoid of a basic necessity like power.”
The government is targeting the completion of household electrification by
December 2018. Industry observers believe that this represents a natural transition
of government policy from electrification of villages to connecting households.
Access to energy is central to development and this initiative to expedite that access
is strongly positive for growth.
Under the Deen Dayal Upadhyaya Gram Jyoti Yojana, the government had
decided to electrify 18,452 unelectrified villages within 1,000 days, by May 1,
2018. Today, there are only 3,000 unelectrified villages left in the country, Modi
said.
Capacit'e Infra Projects Ltd (CIL). - Book Profit
We have recommended SUBSCRBE to Capacit'e Infra Projects Ltd (CIL). Largely
owing to, CIL’s experienced management, revenue visibility, and strong track
record of timely delivery of projects and strong relationships, which gave us
comfort hat it would continue to gain incremental order inflow going ahead.
It got listed yesterday at `399 per share; 60% premium to issue price. Finally,
closed at `342.40, which is premium of 37%. AT CMP it trades at 33x FY17
Earnings. Hence we recommend to booking profit in Capacit’e Infra Projects Ltd.
Economic and Political News
RBI caps banks' investment limit in deposit-taking NBFCs at 10%
PM Narendra Modi forms Economic Advisory Council; Bibek Debroy to head it
3,000 State schemes to be brought under Direct Benefit transfer scheme (DBT
) ambit
RBI has been intervening to stem rupee's appreciation: Arvind Subramanian
Corporate News
Maruti to launch premium S-Cross in a brand new avatar
GAIL plans to set up petrochemical complex in Andhra Pradesh
Aditya Birla Capital receives in-principle nod from RBI to set up an asset
reconstruction company
Market Outlook
September 26, 2017
Top Picks
Market Cap
CMP
Target
Upside
Company
Rationale
(` Cr)
(`)
(`)
(%)
Strong growth in domestic business due to its leadership
in acute therapeutic segment. Alkem expects to launch
Alkem Laboratories
22,066
1,846
2,079
12.6
more products in USA, which bodes for its international
business.
We expect the company would report strong profitability
Asian Granito
1,437
478
570
19.3
owing to better product mix, higher B2C sales and
amalgamation synergy.
Favorable outlook for the AC industry to augur well for
Cooling products business which is out pacing the
Blue Star
7,307
763
850
11.4
market growth. EMPPAC division's profitability to
improve once operating environment turns around.
With a focus on the low and medium income (LMI)
consumer segment, the company has increased its
Dewan Housing Finance
16,447
525
610
16.3
presence in tier-II & III cities where the growth
opportunity is immense.
Loan growth is likely to pick up after a sluggish FY17.
Lower credit cost will help in strong bottom-line growth.
Karur Vysya Bank
8,705
144
180
25.0
Increasing share of CASA will help in NIM
improvement.
High order book execution in EPC segment, rising B2C
KEI Industries
2,470
318
371
16.9
sales and higher exports to boost the revenues and
profitability
Expected to benefit from the lower capex requirement
Music Broadcast
2,216
388
434
11.7
and 15 year long radio broadcast licensing.
Massive capacity expansion along with rail advantage
Navkar Corporation
2,638
185
265
43.2
at ICD as well CFS augurs well for the company
Strong brands and distribution network would boost
Siyaram Silk Mills
2,038
2,174
2,500
15.0
growth going ahead. Stock currently trades at an
inexpensive valuation.
Market leadership in Hindi news genre and no.
2
viewership ranking in English news genre, exit from the
TV Today Network
2,472
414
484
16.8
radio business, and anticipated growth in ad spends by
corporates to benefit the stock.
After GST, the company is expected to see higher
volumes along with improving product mix. The Gujarat
Maruti Suzuki
2,40,238
7,953
8,658
8.9
plant will also enable higher operating leverage which
will be margin accretive.
We expect loan book to grow at 24.3% over next two
GIC Housing
2,693
500
655
31.0
year; change in borrowing mix will help in NIM
improvement..
Source: Company, Angel Research
Market Outlook
September 26, 2017
Key Upcoming Events
Global economic events release calendar
Bl oomberg Data
D ate
Time
C ountry
Event Description
Unit
Period
L ast Reporte d
E stimate d
Sep 26, 2017
7:30 PM US
Consumer Confidence
S.A./ 1985=100
Sep
122.90
120.00
7:30 PM US
New home sales
Thousands
Aug
571.00
587.50
Sep 28, 2017
2:30 PM Euro Zone
Euro-Zone Consumer Confidence
Value
Sep F
(1.20)
(1.20)
6:00 PM US
Initial Jobless claims
Thousands
Sep 23
259.00
270.00
6:00 PM US
GDP Qoq (Annualise d)
% Change
2Q T
3.00
3.10
Sep 29, 2017
6:30 AM China
PMI Manufacturing
Value
Sep
51.70
51.50
1:25 PM Germany
Unempl oyment change (000's)
Thousands
Sep
(5.00)
(5.00)
Sep 30, 2017
2:00 PM UK
GDP (YoY)
% Change
2Q F
1.70
1.70
Oct 02, 2017
1:25 PM Germany
PMI Manufacturing
Value
Sep F
60.60
2:00 PM UK
PMI Manufacturing
Value
Sep
56.90
Oct 04, 2017
1:25 PM Germany
PMI Services
Value
Sep F
55.60
2:30 PM India
RBI Reverse Re po rate
%
Oct 4
5.75
2:30 PM India
RBI Repo rate
%
Oct 4
6.00
2:30 PM India
RBI Cash Reserve ratio
%
Oct 4
4.00
Oct 06, 2017
6:00 PM US
Change in N onfarm payrolls
Thousands
Sep
156.00
50.00
6:00 PM US
Unnemployment rate
%
Sep
4.40
4.40
Oct 10, 2017
India
Imports YoY%
% Change
Sep
21.00
2:00 PM UK
Industrial Production (YoY)
% Change
Aug
0.40
India
Exports YoY%
% Change
Sep
10.30
Oct 12, 2017
US
Producer Price Index (mom)
% Change
Sep
0.50
5:30 PM India
Industrial Production YoY
% Change
Aug
1.20
Oct 13, 2017
6:00 PM US
Consumer price index (mom)
% Change
Sep
0.40
0.50
China
Exports YoY%
% Change
Sep
5.60
Oct 16, 2017
12: 00 PM India
Monthly Wholesale Prices YoY%
% Change
Sep
3.24
Source: Bloomberg, Angel Research
Market Outlook
September 26, 2017
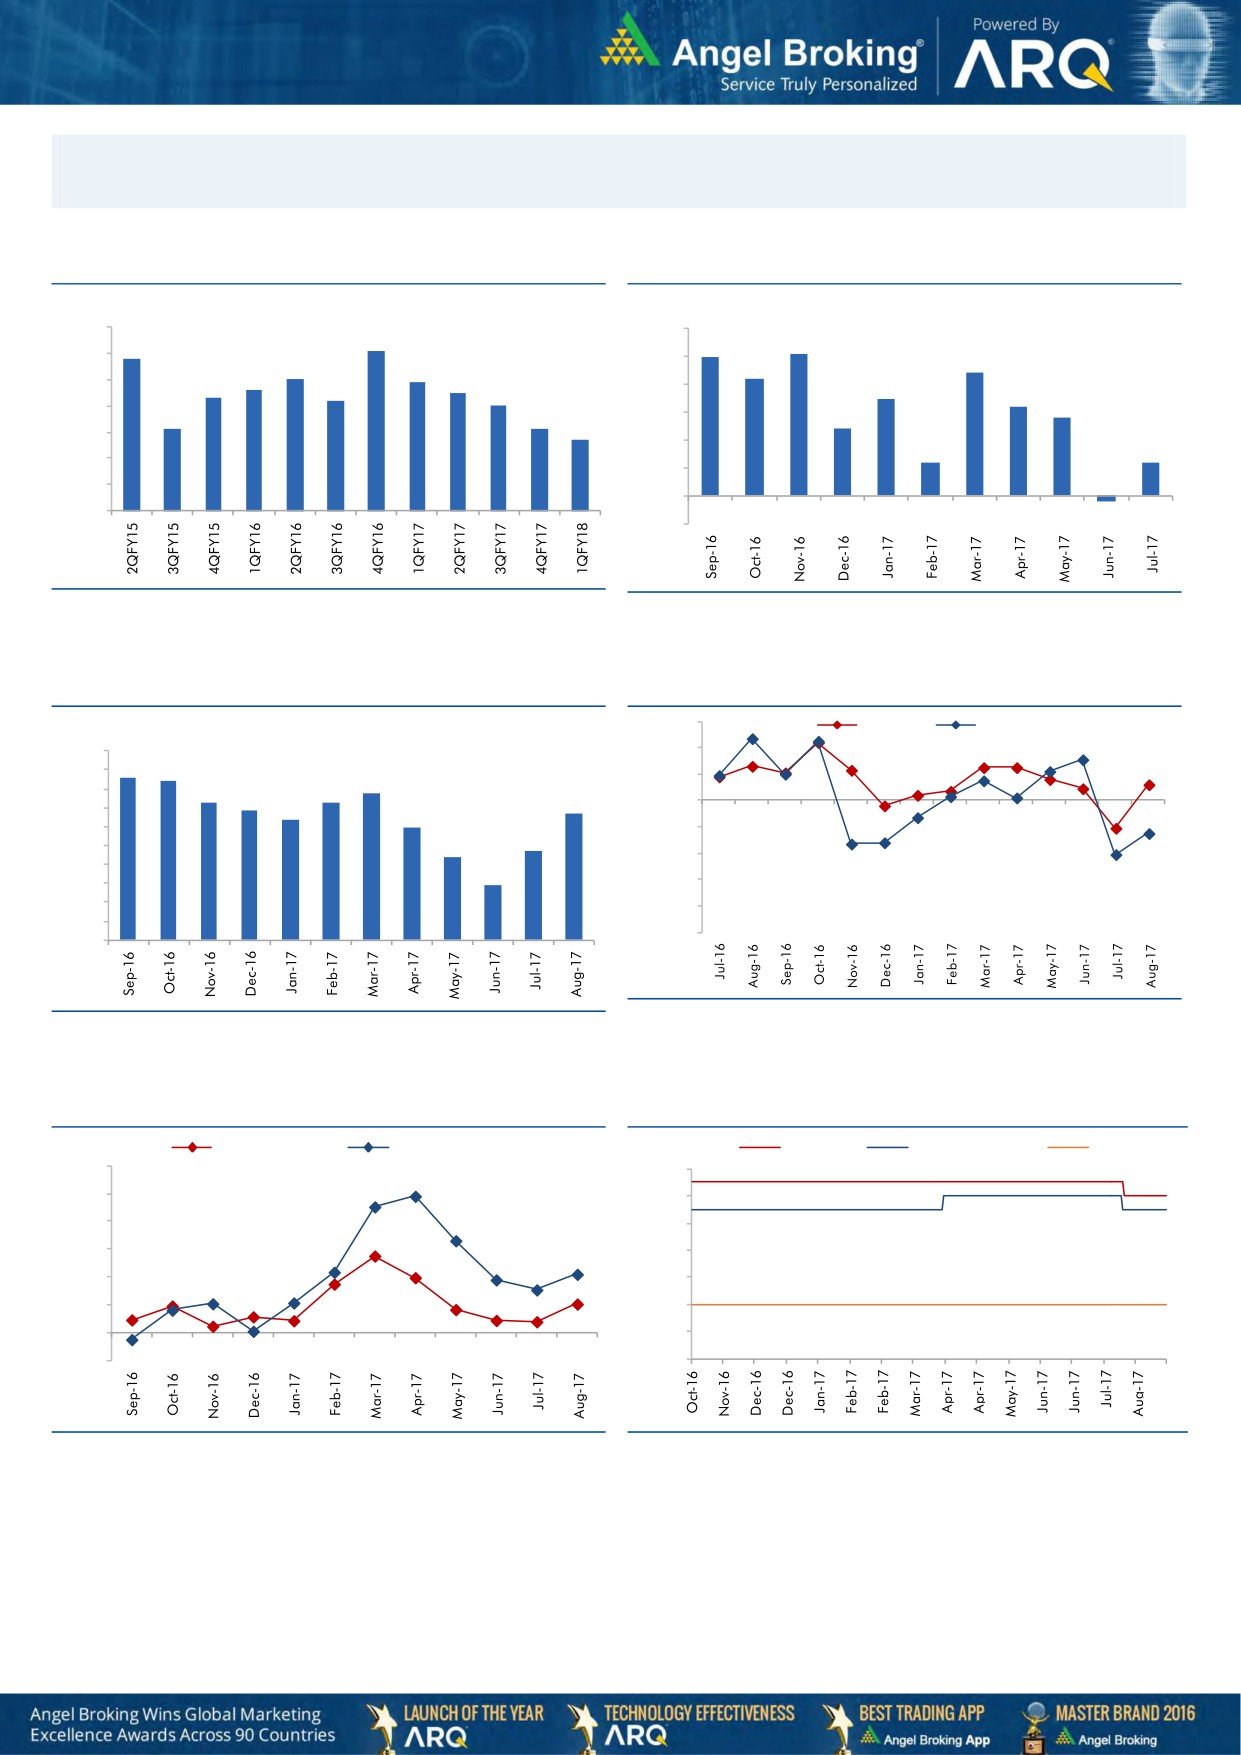
Macro watch
Exhibit 1: Quarterly GDP trends
Exhibit 2: IIP trends
(%)
(%)
10.0
6.0
9.1
5.1
8.8
5.0
9.0
5.0
4.4
8.0
7.9
4.2
7.6
7.5
8.0
7.3
7.2
4.0
3.5
7.0
3.2
2.8
7.0
6.1
6.1
3.0
2.4
5.7
6.0
2.0
1.2
1.2
5.0
1.0
4.0
-
3.0
(1.0)
(0.2)
Source: CSO, Angel Research
Source: MOSPI, Angel Research
Exhibit 3: Monthly CPI inflation trends
Exhibit 4: Manufacturing and services PMI
56.0
Mfg. PMI
Services PMI
(%)
5.0
54.0
4.3
4.2
4.5
3.9
52.0
4.0
3.6
3.7
3.4
3.4
3.2
50.0
3.5
3.0
3.0
48.0
2.4
2.2
2.5
46.0
2.0
1.5
1.5
44.0
1.0
42.0
0.5
40.0
-
Source: Market, Angel Research; Note: Level above 50 indicates expansion
Source: MOSPI, Angel Research
Exhibit 5: Exports and imports growth trends
Exhibit 6: Key policy rates
(%)
Exports yoy growth
Imports yoy growth
(%)
Repo rate
Reverse Repo rate
CRR
60.0
6.50
50.0
6.00
40.0
5.50
30.0
5.00
20.0
4.50
10.0
4.00
0.0
3.50
(10.0)
3.00
Source: Bloomberg, Angel Research
Source: RBI, Angel Research
Market Outlook
September 26, 2017
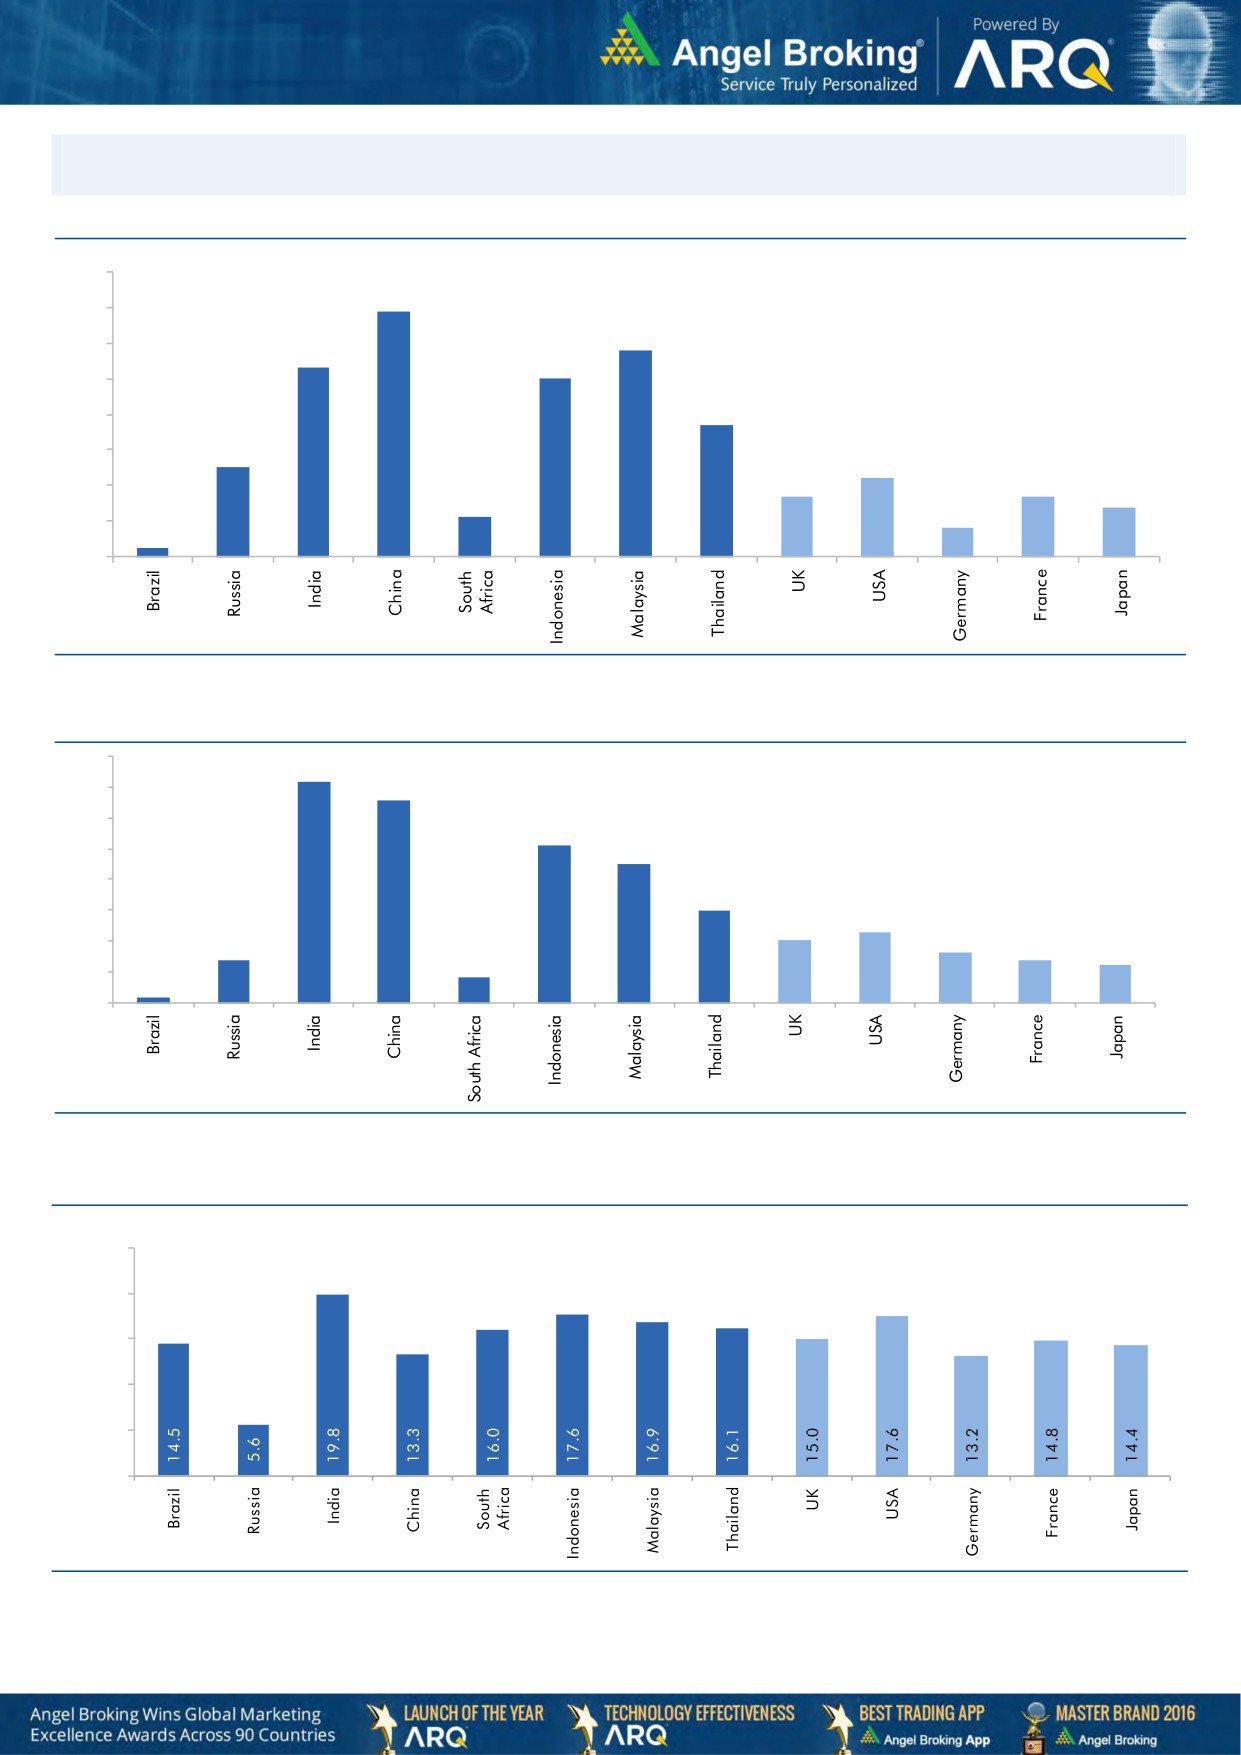
Global watch
Exhibit 1: Latest quarterly GDP Growth (%, yoy) across select developing and developed countries
(%)
8.0
6.9
7.0
5.8
6.0
5.3
5.0
5.0
1.1
3.7
4.0
2.5
3.0
2.2
1.7
1.7
2.0
1.4
0.8
1.0
0.3
-
Source: Bloomberg, Angel Research
Exhibit 2: 2017 GDP Growth projection by IMF (%, yoy) across select developing and developed countries
(%)
7.2
6.6
7.0
6.0
5.1
5.0
4.5
4.0
3.0
3.0
2.3
2.0
1.4
1.6
2.0
1.4
1.2
0.2
0.8
1.0
-
Source: IMF, Angel Research
Exhibit 3: One year forward P-E ratio across select developing and developed countries
(x)
25.0
20.0
15.0
10.0
5.0
-
Source: IMF, Angel Research, data as of 20th Sept-17
Market Outlook
September 26, 2017
Exhibit 4: Relative performance of indices across globe
Returns (%)
C ountry
Name of index
Closing price
1M
3M
1YR
Brazil
Bovespa
74,443
5.6
19.7
27.5
Russia
Micex
2,069
4.8
10.1
4.7
India
Nifty
9,873
0.2
2.5
12.5
China
Shanghai Composite
3,342
0.2
5.2
11.2
South Africa
Top 40
49,565
(0.3)
9.3
11.9
Mexico
Mexbol
50,368
(2.1)
2.6
5.5
Indonesia
LQ45
981
(0.7)
1.2
6.1
Malaysia
KLCI
1,769
(0.4)
(1.1)
6.5
Thailand
SET 50
1,067
6.4
7.3
12.1
USA
Dow Jones
22,296
2.2
4.2
23.2
UK
FTSE
7,301
(1.1)
(2.0)
7.3
Japan
Nikkei
20,398
5.0
1.4
24.3
Germany
DAX
12,595
3.4
(0.6)
21.0
France
CAC
5,267
3.0
0.2
18.3
Source: Bloomberg, Angel Research, data as of 20th Sept-17 p68in4
Stock Watch
September 26, 2017
Company Name
Reco
CMP
Target
Mkt Cap
Sales ( Čcr )
OPM(%)
EPS (Č)
PER(x)
P/BV(x)
RoE(%)
EV/Sales(x)
(Č)
Price ( Č)
( Č cr )
FY18E FY19E
FY18E
FY19E
FY18E
FY19E
FY18E
FY19E
FY18E
FY19E
FY18E
FY19E
FY18E
FY19E
Agri / Agri Chemical
Rallis
Neutral
213
-
4,141
1,873
2,099
15.0
15.0
9.5
10.5
22.4
20.3
3.4
3.1
15.8
16.0
2.1
1.9
United Phosphorus
Neutral
787
-
40,000
18,922
21,949
18.0
18.5
36.2
45.6
21.8
17.3
4.6
3.8
22.7
23.8
2.3
1.9
Auto & Auto Ancillary
Ashok Leyland
Accumulate
113
127
33,041
23,339
27,240
10.1
10.8
4.7
6.2
24.3
18.2
4.9
4.3
20.0
23.6
1.4
1.2
Bajaj Auto
Neutral
3,039
-
87,927
23,936
27,955
19.5
20.1
142.7
167.3
21.3
18.2
4.6
4.1
21.8
22.8
3.3
2.7
Bharat Forge
Neutral
1,223
-
28,464
7,637
8,755
21.7
23.2
36.1
47.3
33.9
25.9
6.1
5.2
18.5
20.8
3.6
3.0
Eicher Motors
Neutral
30,980
-
84,335
19,043
22,837
19.5
19.9
835.4
1,019.0
37.1
30.4
13.9
10.7
40.9
37.8
4.3
3.5
Gabriel India
Neutral
195
-
2,797
1,782
2,033
9.7
10.2
7.1
8.9
27.4
22.0
5.5
4.7
21.0
22.2
1.5
1.3
Hero Motocorp
Accumulate
3,756
4,129
74,999
32,239
36,878
16.0
15.6
184.4
206.5
20.4
18.2
6.4
5.6
31.3
30.7
2.1
1.8
Jamna Auto Industries Neutral
256
-
2,039
1,441
1,662
14.4
14.8
13.9
17.6
18.4
14.5
5.0
4.1
30.0
31.0
1.4
1.2
Mahindra and Mahindra Neutral
1,259
-
78,217
46,971
53,816
13.6
14.0
67.7
79.8
18.6
15.8
2.7
2.4
15.0
15.9
1.6
1.3
Maruti
Accumulate
7,953
8,658
240,238
81,825
101,245
15.0
15.0
283.5
356.0
28.1
22.3
6.1
5.0
21.9
22.4
2.6
2.0
Minda Industries
Neutral
833
-
7,199
4,328
5,084
11.0
11.9
27.3
36.4
30.6
22.9
6.5
5.1
23.1
25.6
1.7
1.5
Motherson Sumi
Neutral
334
-
70,302
55,937
64,445
10.8
11.4
16.9
21.1
19.8
15.9
4.4
4.5
25.2
25.4
1.3
1.1
Tata Motors
Neutral
408
-
117,862
303,167
343,649
11.8
13.8
33.1
54.7
12.3
7.5
2.0
1.6
16.9
23.0
0.4
0.4
TVS Motor
Neutral
642
-
30,496
13,992
16,216
9.0
9.4
17.1
20.3
37.7
31.6
10.0
7.7
29.7
27.7
2.1
1.8
Amara Raja Batteries
Buy
739
858
12,630
6,140
7,122
14.3
15.6
29.3
39.0
25.2
19.0
4.3
3.6
17.1
19.0
2.1
1.8
Exide Industries
Neutral
208
-
17,667
8,689
9,854
15.1
15.2
9.7
11.0
21.5
18.9
3.8
3.4
15.7
16.1
1.8
1.5
Apollo Tyres
Neutral
249
-
12,695
15,739
17,326
13.3
14.6
20.4
26.7
12.2
9.3
1.5
1.3
20.4
26.7
1.0
0.9
Ceat
Neutral
1,686
-
6,820
6,661
7,717
11.1
14.2
116.2
178.2
14.5
9.5
2.5
2.1
15.2
21.3
1.1
1.0
JK Tyres
Neutral
150
-
3,402
8,318
9,239
16.2
16.4
21.0
27.5
7.2
5.5
1.4
1.1
19.1
20.4
0.9
0.7
Swaraj Engines
Neutral
2,050
-
2,546
788
889
16.4
16.5
71.6
81.0
28.6
25.3
8.3
7.7
29.6
31.0
2.9
2.5
Subros
Neutral
223
-
1,338
1,855
2,135
11.6
11.8
10.3
14.7
21.8
15.2
3.3
2.8
15.8
19.1
0.9
0.8
Capital Goods
BEML
Neutral
1,676
-
6,980
4,286
5,194
7.1
8.2
42.9
58.1
39.1
28.9
3.2
2.9
7.6
8.7
1.7
1.4
Bharat Electronics
Neutral
181
-
40,429
10,258
12,470
19.6
19.5
7.3
8.6
24.8
21.1
0.5
0.4
20.4
21.9
3.4
2.8
Voltas
Neutral
510
-
16,867
6,778
8,004
9.6
11.0
17.1
22.4
29.8
22.8
7.1
6.2
17.7
19.8
2.2
1.8
BHEL
Neutral
127
-
31,170
33,200
39,167
6.8
9.5
6.2
11.2
20.5
11.4
0.9
0.9
4.6
8.0
0.5
0.4
Blue Star
Accumulate
763
850
7,307
5,220
6,207
6.3
6.6
16.8
22.3
45.4
34.2
9.0
8.0
19.9
23.3
1.4
1.1
CG Power and Industrial
Neutral
79
-
4,951
6,555
7,292
7.5
7.5
-
0.8
7,900.0
98.8
1.2
1.2
0.1
1.2
0.8
0.8
Solutions
Greaves Cotton
Neutral
136
-
3,326
1,778
1,993
14.7
15.1
8.1
9.1
16.8
15.0
3.8
3.5
21.8
23.6
1.6
1.5
Stock Watch
September 26, 2017
Company Name
Reco
CMP
Target
Mkt Cap
Sales ( Čcr )
OPM(%)
EPS (Č)
PER(x)
P/BV(x)
RoE(%)
EV/Sales(x)
(Č)
Price ( Č)
( Č cr )
FY18E FY19E
FY18E
FY19E
FY18E
FY19E
FY18E
FY19E
FY18E
FY19E
FY18E
FY19E
FY18E
FY19E
Capital Goods
KEC International
Buy
301
350
7,750
9,779
11,113
9.4
9.8
14.2
18.2
21.2
16.6
4.1
3.3
21.1
22.1
1.1
0.9
KEI Industries
Buy
318
371
2,470
3,001
3,391
10.0
10.0
13.0
16.1
24.4
19.7
4.4
3.7
18.2
18.7
1.0
0.9
Thermax
Neutral
850
-
10,134
4,125
4,747
10.3
10.8
26.7
31.5
31.9
27.0
3.6
3.3
11.2
12.0
2.2
1.9
VATech Wabag
Accumulate
599
681
3,268
3,867
4,126
9.6
10.0
34.9
39.8
17.2
15.0
2.8
2.4
17.7
17.5
0.9
0.8
Cement
ACC
Neutral
1,632
-
30,640
12,255
13,350
13.5
14.3
58.0
66.2
28.1
24.7
3.3
3.1
11.5
12.2
2.5
2.3
Ambuja Cements
Neutral
263
-
52,173
10,250
11,450
17.5
19.0
7.2
8.3
36.5
31.7
2.6
2.5
7.0
7.8
4.9
4.3
India Cements
Neutral
168
-
5,166
6,135
6,750
14.8
15.2
8.5
11.5
19.7
14.6
1.0
0.9
4.8
6.2
1.2
1.0
JK Cement
Neutral
944
-
6,603
4,150
4,775
19.2
20.0
49.0
63.5
19.3
14.9
3.1
2.6
17.0
18.5
2.0
1.7
J K Lakshmi Cement
Neutral
387
-
4,554
3,422
3,757
15.5
17.0
13.5
23.2
28.7
16.7
3.0
2.6
10.8
15.5
1.7
1.5
Orient Cement
Neutral
153
-
3,130
2,215
3,233
16.8
17.0
5.9
6.9
25.9
22.1
2.0
1.8
10.8
10.1
2.4
1.6
UltraTech Cement
Neutral
3,911
-
107,369
28,250
35,150
20.2
23.5
77.5
122.2
50.5
32.0
4.3
3.9
9.6
14.8
4.3
3.4
Construction
KNR Constructions
Neutral
209
-
2,935
1,846
2,203
14.5
14.5
12.1
13.7
17.3
15.3
0.9
0.8
17.5
16.7
1.6
1.4
Larsen & Toubro
Neutral
1,165
-
163,115
95,787
109,476
10.2
11.6
44.5
50.8
26.2
23.0
3.3
3.0
12.9
13.1
2.3
2.0
Gujarat Pipavav Port
Neutral
133
-
6,418
739
842
61.6
62.7
5.1
6.2
26.0
21.6
3.3
3.2
12.7
14.9
8.1
7.0
PNC Infratech
Accumulate
134
143
3,426
2,040
2,935
13.0
13.0
6.4
9.0
20.9
14.8
0.5
0.5
9.7
12.2
1.7
1.2
Simplex Infra
Neutral
452
-
2,236
6,012
6,619
11.6
11.7
21.1
31.0
21.5
14.6
1.5
1.4
6.5
8.6
0.9
0.8
Sadbhav Engineering
Neutral
288
-
4,941
3,823
4,426
10.7
10.8
10.3
11.8
28.0
24.4
3.4
2.9
10.1
10.5
1.6
1.4
NBCC
Neutral
211
-
19,022
9,099
12,706
6.4
6.4
7.3
9.6
29.0
22.1
1.3
1.0
27.5
30.5
2.0
1.4
MEP Infra
Neutral
100
-
1,631
2,403
2,910
18.3
16.8
2.4
6.1
42.7
16.5
16.2
10.9
35.2
55.8
1.8
1.5
SIPL
Neutral
96
-
3,385
2,060
2,390
46.8
47.7
(5.8)
(3.1)
3.6
4.1
(14.2)
(2.3)
6.4
6.0
Engineers India
Neutral
153
-
10,317
1,795
2,611
21.1
22.4
5.9
8.1
26.0
18.9
1.9
1.8
12.9
16.1
4.1
2.7
Financials
Axis Bank
Buy
501
580
120,191
32,558
35,843
3.5
3.2
27.8
41.0
18.0
12.2
2.0
1.7
11.4
14.9
-
-
Bank of Baroda
Neutral
142
-
32,800
22,533
26,079
2.4
2.4
12.0
20.9
11.9
6.8
0.8
0.7
6.6
11.0
-
-
Canara Bank
Neutral
325
-
19,430
17,925
20,235
2.0
2.1
18.5
36.5
17.6
8.9
0.7
0.6
3.4
6.2
-
-
Can Fin Homes
Neutral
2,588
-
6,889
586
741
3.5
3.5
107.8
141.0
24.0
18.4
5.3
4.3
24.1
25.6
-
-
Cholamandalam Inv. &
Accumulate
1,097
1,230
17,142
2,826
3,307
6.3
6.3
53.7
64.6
20.4
17.0
3.5
3.0
18.3
18.9
-
-
Fin. Co.
Dewan Housing Finance Buy
525
610
16,447
2,676
3,383
2.4
2.7
37.4
49.7
14.0
10.6
1.8
1.6
13.8
16.2
-
-
Equitas Holdings
Buy
156
235
5,284
1,125
1,380
9.6
9.8
1.5
6.0
104.0
26.0
2.4
2.2
2.4
8.2
-
-
Federal Bank
Accumulate
112
125
21,749
4,896
5,930
2.8
3.1
5.4
7.6
20.8
14.7
1.8
1.6
8.5
11.0
-
-
Stock Watch
September 26, 2017
Company Name
Reco
CMP
Target
Mkt Cap
Sales ( Čcr )
OPM(%)
EPS (Č)
PER(x)
P/BV(x)
RoE(%)
EV/Sales(x)
(Č)
Price ( Č)
( Č cr )
FY18E FY19E
FY18E
FY19E
FY18E
FY19E
FY18E
FY19E
FY18E
FY19E
FY18E
FY19E
FY18E
FY19E
Financials
GIC Housing
Buy
500
655
2,693
376
477
3.6
3.7
33.0
40.0
15.2
12.5
2.7
2.3
20.0
23.0
-
-
HDFC Bank
Neutral
1,799
-
464,380
55,236
63,253
4.5
4.4
68.9
82.4
26.1
21.8
4.6
3.8
18.7
18.5
-
-
ICICI Bank
Accumulate
280
315
179,331
42,361
51,378
3.6
3.9
18.4
25.7
15.2
10.9
1.7
1.6
11.3
15.0
-
-
Karur Vysya Bank
Buy
144
180
8,705
3,289
3,630
3.7
3.9
10.8
14.1
13.3
10.2
1.6
1.4
12.5
14.7
-
-
LIC Housing Finance
Neutral
622
-
31,388
4,895
6,332
3.4
3.7
50.7
66.8
12.3
9.3
2.5
2.0
21.7
23.8
-
-
Punjab Natl.Bank
Neutral
138
-
29,302
23,708
25,758
2.1
2.1
5.9
16.4
23.4
8.4
0.7
0.7
3.0
8.3
-
-
RBL Bank
Neutral
513
-
21,173
2,309
2,888
2.6
2.5
16.4
19.1
31.3
26.9
3.9
3.5
13.3
13.8
-
-
Repco Home Finance
Buy
613
825
3,837
496
597
4.4
4.2
38.5
48.7
15.9
12.6
2.9
2.4
19.6
20.6
-
-
South Ind.Bank
Neutral
29
-
5,161
3,195
3,567
3.0
3.1
3.0
3.8
9.5
7.5
0.9
0.8
10.5
11.9
-
-
St Bk of India
Neutral
259
-
223,268
105,827
121,056
2.4
2.5
16.1
25.6
16.1
10.1
1.3
1.2
6.6
9.9
-
-
Union Bank
Neutral
130
-
9,454
14,650
16,225
2.3
2.3
23.1
32.5
5.6
4.0
0.4
0.4
7.1
9.2
-
-
Yes Bank
Neutral
360
-
82,342
11,088
13,138
3.0
2.9
84.0
99.3
4.3
3.6
0.7
0.6
16.3
16.8
-
-
FMCG
Akzo Nobel India
Neutral
1,816
-
8,708
3,164
3,607
13.8
13.7
58.6
67.9
31.0
26.7
7.6
6.7
24.5
25.1
2.6
2.3
Asian Paints
Neutral
1,196
-
114,744
17,603
20,615
18.6
18.6
2,128.9
2,543.3
0.6
0.5
11.8
10.0
28.0
28.9
6.3
5.3
Britannia
Neutral
4,280
-
51,388
9,690
11,278
14.8
15.4
84.0
101.0
51.0
42.4
18.6
14.8
40.6
39.0
5.3
4.5
Colgate
Neutral
1,085
-
29,509
4,420
5,074
24.9
25.3
28.6
32.8
37.9
33.1
15.0
12.1
43.8
40.5
6.4
5.6
Dabur India
Neutral
313
-
55,056
8,346
9,344
19.6
19.9
7.8
9.0
40.1
34.7
8.1
7.3
25.2
24.8
6.2
5.5
GlaxoSmith Con*
Neutral
4,946
-
20,800
5,072
5,760
18.2
18.4
176.3
199.2
28.1
24.8
6.0
5.4
21.2
21.7
3.4
3.0
Godrej Consumer
Neutral
933
-
63,534
10,171
11,682
20.8
21.5
21.7
27.1
43.0
34.4
9.7
8.3
22.3
23.4
6.4
5.5
HUL
Neutral
1,246
-
269,770
37,077
41,508
20.3
21.8
5,189.9
6,318.5
0.2
0.2
38.0
32.5
74.8
82.0
7.1
6.4
ITC
Neutral
262
-
319,611
44,588
49,853
37.0
37.3
9.6
11.0
27.3
23.9
6.7
6.4
25.1
27.3
6.7
5.9
Marico
Neutral
319
-
41,134
6,788
7,766
18.5
19.2
7.1
8.5
44.9
37.5
15.7
13.5
36.9
38.0
5.9
5.1
Nestle*
Neutral
7,131
-
68,758
10,083
11,182
20.0
20.9
119.7
141.3
59.6
50.5
210.0
191.9
36.7
39.8
6.5
5.8
Tata Global
Neutral
197
-
12,411
7,121
7,641
11.9
12.3
6.9
8.0
28.5
24.6
1.9
1.8
6.8
7.2
1.5
1.4
Procter & Gamble
Neutral
8,348
-
27,098
3,034
3,579
27.1
27.7
167.7
198.8
49.8
42.0
13.4
11.5
28.8
29.5
8.4
7.0
Hygiene
IT
HCL Tech^
Buy
873
1,014
124,526
52,342
57,053
20.9
20.9
62.8
67.6
13.9
12.9
3.1
2.7
22.4
20.6
2.1
1.8
Infosys
Buy
897
1,179
205,958
73,963
80,619
26.0
26.0
64.4
69.3
13.9
12.9
2.7
2.5
19.7
19.6
2.2
2.0
TCS
Accumulate
2,508
2,651
494,223
127,403
138,870
27.6
27.6
144.5
156.0
17.4
16.1
5.2
4.8
29.7
29.8
3.5
3.2
Tech Mahindra
Buy
452
533
44,062
31,015
33,496
15.0
15.0
35.6
38.1
12.7
11.9
2.2
2.0
17.0
16.3
1.2
1.0
Stock Watch
September 26, 2017
Company Name
Reco
CMP
Target
Mkt Cap
Sales ( Čcr )
OPM(%)
EPS (Č)
PER(x)
P/BV(x)
RoE(%)
EV/Sales(x)
(Č)
Price ( Č)
( Č cr )
FY18E FY19E
FY18E
FY19E
FY18E
FY19E
FY18E
FY19E
FY18E
FY19E
FY18E
FY19E
FY18E
FY19E
IT
Wipro
Neutral
292
-
141,913
58,536
61,858
20.3
20.3
18.2
19.1
16.0
15.3
2.5
2.2
14.6
13.4
2.4
2.2
Media
D B Corp
Neutral
366
-
6,726
2,404
2,625
30.5
31.5
23.7
26.9
15.4
13.6
3.6
3.1
23.5
22.8
2.6
2.4
HT Media
Neutral
95
-
2,201
2,589
2,830
15.1
15.4
8.3
10.9
11.4
8.7
0.9
0.8
8.4
10.4
0.4
0.3
Jagran Prakashan
Buy
173
225
5,670
2,541
2,835
28.5
28.7
12.7
14.1
13.7
12.3
2.8
2.5
21.3
21.4
2.1
1.8
Sun TV Network
Neutral
787
-
31,014
3,238
3,789
51.9
55.1
30.9
38.0
25.5
20.7
7.3
6.4
30.0
31.0
9.1
7.7
Hindustan Media
Neutral
262
-
1,919
1,002
1,074
23.3
23.5
29.2
33.8
9.0
7.7
1.4
1.2
15.6
15.4
0.9
0.6
Ventures
TV Today Network
Neutral
414
-
2,472
667
727
27.7
27.7
18.6
20.1
22.3
20.7
3.5
3.5
15.6
17.3
3.2
3.0
Music Broadcast Limited Accumulate
388
434
2,216
271
317
91.0
109.0
6.0
10.0
64.7
38.8
4.0
3.7
6.5
9.3
7.8
6.4
Metals & Mining
Coal India
Neutral
257
-
159,499
82,301
91,235
17.0
18.0
17.1
20.5
15.0
12.5
2.8
2.7
45.0
55.0
1.6
1.4
Hind. Zinc
Neutral
292
-
123,358
22,108
24,555
57.0
58.0
22.1
26.3
13.2
11.1
4.3
3.5
32.0
35.0
4.6
3.8
Hindalco
Neutral
229
-
51,412
102,350
105,355
13.5
14.5
21.5
24.5
10.7
9.4
1.5
1.2
15.0
15.2
1.1
1.0
JSW Steel
Neutral
237
-
57,276
64,500
68,245
21.1
21.5
20.1
21.2
11.8
11.2
2.2
1.9
-
-
1.6
1.5
NMDC
Neutral
120
-
38,077
10,209
11,450
47.0
48.0
11.1
12.1
10.8
10.0
1.5
1.4
-
-
3.2
2.9
SAIL
Neutral
57
-
23,418
54,100
63,555
3.0
10.0
(10.0)
1.5
37.8
0.8
0.8
-
-
1.4
1.2
Vedanta
Neutral
307
-
114,044
81,206
87,345
28.0
29.0
26.5
33.5
11.6
9.2
2.6
2.3
-
-
2.2
1.8
Tata Steel
Neutral
640
-
62,172
121,445
126,500
16.2
17.2
65.4
81.3
9.8
7.9
1.6
1.3
-
-
1.0
0.9
Oil & Gas
GAIL
Neutral
398
-
67,263
53,115
52,344
14.2
15.3
30.0
31.1
13.3
12.8
1.7
1.5
-
-
1.0
1.0
ONGC
Neutral
164
-
211,043
83,111
84,934
44.2
44.9
16.4
16.9
10.0
9.7
1.2
1.1
-
-
2.4
2.4
Indian Oil Corp
Neutral
399
-
193,751
396,116
432,560
8.5
8.8
40.1
42.2
10.0
9.5
1.7
1.5
-
-
0.6
0.6
Reliance Industries
Neutral
820
-
533,604
257,711
267,438
17.0
18.2
89.1
89.5
9.2
9.2
0.9
0.8
-
-
1.7
1.7
Pharmaceuticals
Alembic Pharma
Buy
484
600
9,119
3,903
4,584
18.2
19.2
21.8
27.2
22.2
17.8
4.0
3.4
19.8
20.6
2.4
2.0
Alkem Laboratories Ltd
Accumulate
1,846
2,079
22,066
6,320
7,341
17.5
19.8
72.7
96.6
25.4
19.1
4.5
3.8
16.7
18.7
3.4
2.9
Aurobindo Pharma
Buy
703
823
41,161
17,086
19,478
22.1
22.0
44.7
51.4
15.7
13.7
3.5
2.8
24.7
22.7
2.5
2.2
Aventis*
Neutral
3,994
-
9,198
2,508
2,862
16.8
16.8
139.9
153.8
28.6
26.0
4.1
3.4
23.5
25.8
3.3
2.7
Cadila Healthcare
Reduce
482
426
49,298
11,584
13,228
20.3
20.4
18.7
21.3
25.8
22.6
5.7
4.7
24.6
22.9
4.1
3.5
Cipla
Sell
577
458
46,422
16,619
19,437
15.4
16.2
19.7
24.3
29.3
23.7
3.3
3.0
12.0
13.2
3.0
2.5
Dr Reddy's
Neutral
2,418
-
40,080
15,844
17,973
17.6
18.2
91.7
111.0
26.4
21.8
3.0
2.7
11.9
13.0
2.7
2.4
GSK Pharma*
Neutral
2,427
-
20,553
3,260
3,651
15.0
18.0
46.1
58.6
52.6
41.4
10.8
11.2
20.0
26.5
6.2
5.7
Indoco Remedies
Sell
208
153
1,919
1,154
1,310
14.9
14.9
11.3
12.7
18.4
16.4
2.6
2.3
15.0
15.0
1.8
1.5
Stock Watch
September 26, 2017
Company Name
Reco
CMP
Target
Mkt Cap
Sales ( Čcr )
OPM(%)
EPS (Č)
PER(x)
P/BV(x)
RoE(%)
EV/Sales(x)
(Č)
Price ( Č)
( Č cr )
FY18E FY19E
FY18E
FY19E
FY18E
FY19E
FY18E
FY19E
FY18E
FY19E
FY18E
FY19E
FY18E
FY19E
Pharmaceuticals
Ipca labs
Accumulate
496
540
6,256
3,593
4,022
14.5
15.5
19.4
25.2
25.6
19.7
2.3
2.1
9.5
11.2
1.8
1.6
Lupin
Buy
991
1,467
44,787
18,657
21,289
21.3
23.3
52.8
66.7
18.8
14.9
2.8
2.4
16.3
17.5
2.4
2.0
Natco Pharma
Neutral
795
-
13,865
1,836
1,946
31.8
28.9
22.1
20.6
36.0
38.6
7.2
6.4
20.1
16.7
7.4
7.0
Sun Pharma
Accumulate
506
558
121,378
32,899
36,451
26.9
25.4
31.6
32.3
16.0
15.7
2.8
2.5
18.7
18.8
3.3
2.8
Syngene International
Buy
484
557
9,673
1,402
1,823
32.8
36.0
15.9
20.7
30.5
23.4
5.7
4.7
18.7
20.0
6.9
5.3
Power
Tata Power
Neutral
82
-
22,139
32,547
33,806
20.5
20.5
4.7
5.4
17.4
15.3
1.7
1.4
10.5
10.5
1.7
1.6
NTPC
Neutral
166
-
136,916
86,070
101,246
28.3
30.7
12.9
16.2
12.9
10.3
1.3
1.2
10.6
12.4
3.0
2.7
Power Grid
Accumulate
210
223
109,942
29,183
32,946
89.7
90.0
18.0
20.8
11.7
10.1
2.0
1.7
17.7
18.2
7.7
7.1
Real Estate
Prestige Estate
Neutral
251
-
9,429
4,607
5,146
21.0
22.2
7.9
9.8
31.8
25.7
2.0
1.8
10.3
12.0
3.2
2.9
MLIFE
Accumulate
480
522
2,466
487
590
12.3
17.8
21.0
31.2
22.9
15.4
1.2
1.1
5.2
7.4
3.8
3.1
Telecom
Bharti Airtel
Neutral
389
-
155,679
97,903
105,233
36.0
36.3
9.3
11.1
41.9
35.2
2.0
1.9
5.0
5.6
2.5
2.3
Idea Cellular
Neutral
76
-
27,466
35,012
37,689
27.1
27.7
(4.4)
(2.7)
1.2
1.2
(6.8)
(4.6)
2.1
1.9
zOthers
Abbott India
Neutral
4,164
-
8,848
3,244
3,723
14.9
16.1
167.5
209.4
24.9
19.9
5.5
4.6
23.7
24.8
2.4
2.0
Asian Granito
Buy
478
570
1,437
1,169
1,286
12.5
12.5
16.0
19.7
29.9
24.2
3.2
2.8
10.7
11.6
1.5
1.3
Bajaj Electricals
Accumulate
358
395
3,637
4,646
5,301
6.7
7.6
16.1
22.3
22.3
16.1
3.6
3.1
16.4
19.2
0.8
0.7
Banco Products (India)
Neutral
210
-
1,504
1,530
1,695
13.2
12.7
19.0
20.0
11.1
10.5
1.8
1.6
0.2
0.2
0.9
99.0
Coffee Day Enterprises
Neutral
212
-
4,377
3,494
3,913
17.4
18.0
4.8
5.7
-
37.3
1.9
1.8
-
0.1
1.7
1.5
Ltd
Elecon Engineering
Neutral
54
-
608
171
201
15.0
16.2
36.0
43.0
1.5
1.3
0.1
0.1
0.1
0.1
2.9
2.5
Garware Wall Ropes
Neutral
851
-
1,862
928
1,003
15.2
15.2
39.4
43.2
21.6
19.7
3.6
3.0
16.5
15.4
1.9
1.7
Goodyear India*
Neutral
817
-
1,885
1,717
1,866
11.8
12.3
47.9
49.8
17.1
16.4
2.6
2.3
15.6
15.7
0.8
113.5
Hitachi
Neutral
1,890
-
5,139
2,355
2,715
10.3
10.8
49.0
60.9
38.6
31.0
9.0
7.1
0.2
0.2
2.2
1.9
HSIL
Neutral
375
-
2,711
2,240
2,670
14.6
15.0
17.0
22.0
22.1
17.0
1.8
1.7
0.1
0.1
1.4
1.2
Interglobe Aviation
Neutral
1,046
-
37,818
22,570
27,955
14.2
15.0
63.6
81.8
16.5
12.8
8.7
7.3
0.5
0.6
1.4
1.0
Jyothy Laboratories
Neutral
380
-
6,911
1,781
2,044
14.1
15.0
9.4
10.5
40.7
36.2
8.7
8.1
0.2
0.2
4.1
3.5
Linc Pen & Plastics
Neutral
224
-
331
420
462
9.3
9.3
15.3
17.1
14.7
13.1
2.5
2.6
16.9
19.5
0.8
0.8
M M Forgings
Neutral
636
-
768
542
642
20.1
21.0
41.6
56.8
15.3
11.2
2.1
1.8
0.1
0.2
1.8
1.6
Mirza International
Neutral
160
-
1,929
1,148
1,285
18.0
18.0
8.0
9.4
19.9
17.1
3.3
2.8
16.3
16.1
1.8
1.6
Navkar Corporation
Buy
185
265
2,638
561
617
41.5
41.5
11.5
12.7
16.1
14.6
1.7
1.5
10.5
10.4
5.4
4.7
Nilkamal
Neutral
1,528
-
2,281
2,317
2,525
11.4
11.1
96.0
105.0
15.9
14.6
2.7
2.4
0.2
0.2
1.0
0.9
Stock Watch
September 26, 2017
Company Name
Reco
CMP
Target Mkt Cap
Sales ( Čcr )
OPM(%)
EPS (Č)
PER(x)
P/BV(x)
RoE(%)
EV/Sales(x)
(Č)
Price ( Č)
( Č cr )
FY18E FY19E FY18E FY19E FY18E FY19E FY18E FY19E FY18E FY19E FY18E FY19E FY18E FY19E
zOthers
Parag Milk Foods
Neutral
231
-
1,939
1,987
2,379
7.6
9.0
12.4
18.3
18.6
12.6
2.6
2.3
8.2
13.2
1.1
0.9
Radico Khaitan
Neutral
152
-
2,030
1,811
1,992
13.2
13.2
8.1
8.8
18.8
17.3
1.9
2.1
10.1
12.0
1.4
1.3
Relaxo Footwears
Neutral
517
-
6,209
1,981
2,310
13.7
14.5
12.0
15.5
43.1
33.4
8.4
6.8
0.2
0.2
3.2
2.7
Siyaram Silk Mills
Accumulate
2,174
2,500
2,038
1,769
1,981
12.7
12.7
113.1
131.1
19.2
16.6
3.0
2.6
15.5
15.5
1.3
1.2
Styrolution ABS India* Neutral
853
-
1,500
1,800
1,980
8.0
8.1
42.0
46.2
20.3
18.5
2.3
2.0
0.1
0.1
1.0
0.9
Surya Roshni
Neutral
297
-
1,302
4,870
5,320
7.7
7.8
22.8
28.1
13.1
10.6
1.7
1.5
0.1
0.1
0.5
0.4
TVS Srichakra
Neutral
3,127
-
2,394
2,729
2,893
12.7
12.5
248.5
265.0
12.6
11.8
3.6
2.9
0.3
0.3
0.9
0.8
Visaka Industries
Neutral
588
-
934
1,104
1,214
12.1
12.6
31.0
37.9
19.0
15.5
2.3
2.1
0.1
0.1
1.1
1.0
VIP Industries
Buy
235
300
3,315
1,450
1,693
10.4
10.5
6.5
7.8
35.9
30.0
7.6
6.6
21.1
22.1
2.3
1.9
Navin Fluorine
Accumulate
643
730
3,170
945
1,154
22.4
22.6
28.7
34.8
22.4
18.5
3.7
3.2
-
-
2.9
2.2
Source: Company, Angel Research; Note: *December year end; #September year end; &October year end; Price as on September 25, 2017
Market Outlook
September 26, 2017
Research Team Tel: 022 - 39357800
DISCLAIMER
Angel Broking Private Limited (hereinafter referred to as “Angel”) is a registered Member of National Stock Exchange of India
Limited,Bombay Stock Exchange Limited and Metropolitan Stock Exchange Limited. It is also registered as a Depository Participant with
CDSL and Portfolio Manager with SEBI. It also has registration with AMFI as a Mutual Fund Distributor. Angel Broking Private Limited is a
registered entity with SEBI for Research Analyst in terms of SEBI (Research Analyst) Regulations, 2014 vide registration number
INH000000164. Angel or its associates has not been debarred/ suspended by SEBI or any other regulatory authority for accessing
/dealing in securities Market. Angel or its associates/analyst has not received any compensation / managed or
co-managed public offering of securities of the company covered by Analyst during the past twelve months.
This document is solely for the personal information of the recipient, and must not be singularly used as the basis of any investment
decision. Nothing in this document should be construed as investment or financial advice. Each recipient of this document should make
such investigations as they deem necessary to arrive at an independent evaluation of an investment in the securities of the companies
referred to in this document (including the merits and risks involved), and should consult their own advisors to determine the merits and
risks of such an investment.
Reports based on technical and derivative analysis center on studying charts of a stock's price movement, outstanding positions and
trading volume, as opposed to focusing on a company's fundamentals and, as such, may not match with a report on a company's
fundamentals. Investors are advised to refer the Fundamental and Technical Research Reports available on our website to evaluate the
contrary view, if any.
The information in this document has been printed on the basis of publicly available information, internal data and other reliable
sources believed to be true, but we do not represent that it is accurate or complete and it should not be relied on as such, as this
document is for general guidance only. Angel Broking Pvt. Limited or any of its affiliates/ group companies shall not be in any way
responsible for any loss or damage that may arise to any person from any inadvertent error in the information contained in this report.
Angel Broking Pvt. Limited has not independently verified all the information contained within this document. Accordingly, we cannot
testify, nor make any representation or warranty, express or implied, to the accuracy, contents or data contained within this document.
While Angel Broking Pvt. Limited endeavors to update on a reasonable basis the information discussed in this material, there may be
regulatory, compliance, or other reasons that prevent us from doing so.
This document is being supplied to you solely for your information, and its contents, information or data may not be reproduced,
redistributed or passed on, directly or indirectly.
Neither Angel Broking Pvt. Limited, nor its directors, employees or affiliates shall be liable for any loss or damage that may arise from
or in connection with the use of this information.